PythonでMatplotlibを用いてグラフを作成する基本サンプル
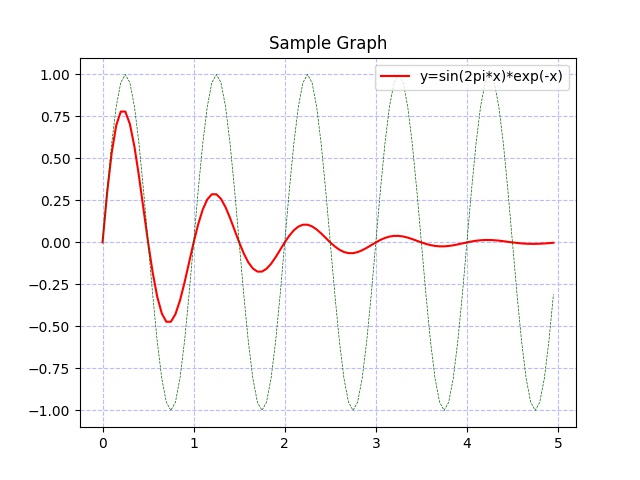
matplotlib.pyplotに直接描画するMATLAB方式で単純なグラフを作成
MATLABで用いられていた流儀、pyplotにplotで直接グラフを描いていく方法。 設定項目が少ないので、あまりお薦めではないが、簡便にグラフを描くには最適
#!/usr/bin/python
# -*- coding: utf-8 -*-

import matplotlib.pyplot as plt
import numpy as np

# x軸の0.0から5.0を100等分
#x = np.linspace(0, 5, 100)
# x軸の0.0から5.0まで0.05間隔で
x = np.arange(0, 5, 0.05)

y1 = np.sin(x * 2 * np.pi) * np.exp(-x)
y2 = np.sin(x * 2 * np.pi)

plt.plot(x, y1, color='red', label='y=sin(2pi*x)*exp(-x)')
plt.plot(x, y2, color='darkgreen', linewidth=0.5, linestyle='--')

plt.grid(color='#bbbbff', linestyle='dashed')
plt.title('Sample Graph')
plt.legend(loc='upper right')

plt.show()
numpy.linspace と numpy.arange の2つのメソッドは、どちらも等差数列を作るのだが、要素数の与え方に注意が少しだけ必要。
たとえば、0 から 5 を10等分した等差数列を作る場合は、次のように「赤で着色した」部分に注意。
>>> np.arange(0, 5+0.5, 0.5)
array([ 0. ,  0.5,  1. ,  1.5,  2. ,  2.5,  3. ,  3.5,  4. ,  4.5,  5. ])

>>> np.linspace(0, 5, 10+1)
array([ 0. ,  0.5,  1. ,  1.5,  2. ,  2.5,  3. ,  3.5,  4. ,  4.5,  5. ])
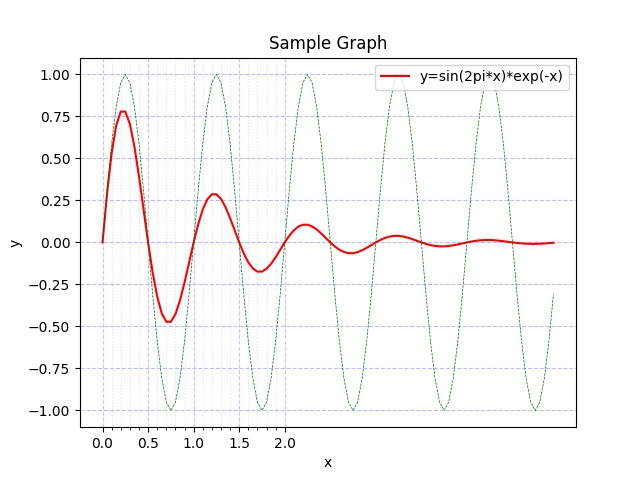
matplotlib.pyplot内にaxesオブジェクトを作成し、そこにグラフを描画する
こちらのほうが、軸やグラフの細かな設定ができる。
#!/usr/bin/python
# -*- coding: utf-8 -*-

import matplotlib.pyplot as plt
import numpy as np

# x軸の0.0から5.0を100等分
#x = np.linspace(0, 5, 100)
# x軸の0.0から5.0まで0.05間隔で
x = np.arange(0, 5, 0.05)

y1 = np.sin(x * 2 * np.pi) * np.exp(-x)
y2 = np.sin(x * 2 * np.pi)

fig, ax = plt.subplots()

ax.plot(x, y1, color='red', label='y=sin(2pi*x)*exp(-x)')
ax.plot(x, y2, color='darkgreen', linewidth=0.5, linestyle='--')

ax.set_xticks(np.linspace(0,2,5))
ax.set_xticks(np.linspace(0,2,21) ,minor=True)
ax.grid(color='#bbbbff', linestyle='dashed', which="major")
ax.grid(color='#ddddff', linestyle='dotted', which="minor")
ax.set_title('Sample Graph')
ax.set_xlabel('x')
ax.set_ylabel('y')
ax.legend()

plt.show()
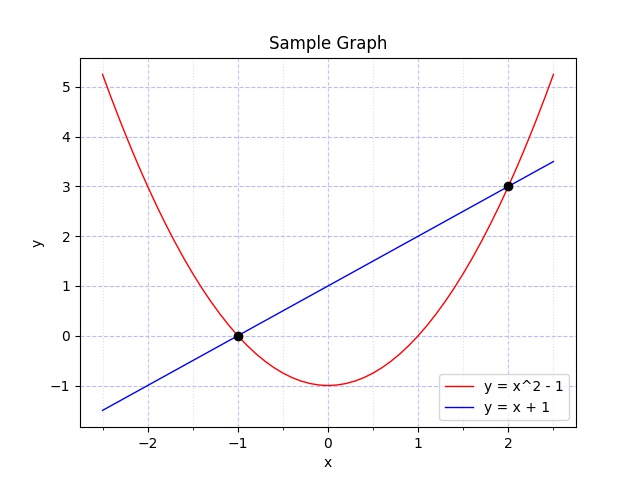
2つの曲線の交点を求める場合
y = x^2 - 1 と、 y = x + 1 の交点は、[x, y] = [-1, 0] と [2, 3] であることを示すグラフを作成するスクリプトは
#!/usr/bin/python
# -*- coding: utf-8 -*-

import matplotlib.pyplot as plt
import numpy as np

x1 = np.arange(-2.5, 2.5+0.1, 0.1)
y1 = x1**2 - 1.0
y2 = x1 + 1

# 交点の数列index No.を求める
crosspoint_x = np.argwhere(np.sign(np.round(y1 - y2, 3)) == 0)

fig, ax = plt.subplots()

ax.plot(x1, y1, color='red', linewidth='1', label='y = x^2 - 1')
ax.plot(x1, y2, color='blue', linewidth='1', label='y = x + 1')
ax.plot(x1[crosspoint_x], y1[crosspoint_x], 'o',  color='black')

ax.set_xticks(np.arange(-2,2+1,1))
ax.set_xticks(np.arange(-2.5,2.5+0.5,0.5) ,minor=True)
ax.grid(color='#bbbbff', linestyle='dashed', which="major")
ax.grid(color='#ddddff', linestyle='dotted', which="minor")
ax.set_title('Sample Graph')
ax.set_xlabel('x')
ax.set_ylabel('y')
ax.legend()

plt.show()
交点は、双方の数列の差分を計算して、その符号(numpy.sign)を計算し、それがゼロとなるリスト番号を抽出する(numpy.argwhere)処理をする。 求められたリスト番号で指し示される[x,y]が、2つの曲線の差分がゼロとなる値(つまり、交点)を見つけ出すという処理をしている。
>>> x1 = np.arange(-2.5, 2.5+0.5, 0.5)
>>> x1
array([-2.5, -2. , -1.5, -1. , -0.5,  0. ,  0.5,  1. ,  1.5,  2. ,  2.5])

>>> y1 = x1**2 - 1.0
>>> y1
array([ 5.25,  3.  ,  1.25,  0.  , -0.75, -1.  , -0.75,  0.  ,  1.25,
        3.  ,  5.25])

>>> y2 = x1 + 1
>>> y2
array([-1.5, -1. , -0.5,  0. ,  0.5,  1. ,  1.5,  2. ,  2.5,  3. ,  3.5])

>>> np.sign(np.round(y1 - y2, 3))
array([ 1.,  1.,  1.,  0., -1., -1., -1., -1., -1.,  0.,  1.])

>>> crosspoint_x = np.argwhere(np.sign(np.round(y1 - y2, 3)) == 0)
>>> crosspoint_x
array([[3],
       [9]])
ソースコードを参考にしたwebサイトは、
crosspoint_x = np.argwhere(np.sign(y1 - y2) == 0)
というコードを用いていたが、浮動小数点の誤差範囲があり、完全にゼロに鳴らない場合もあるので、
crosspoint_x = np.argwhere(np.sign(np.round(y1 - y2, 3)) == 0)
というふうに改変している。
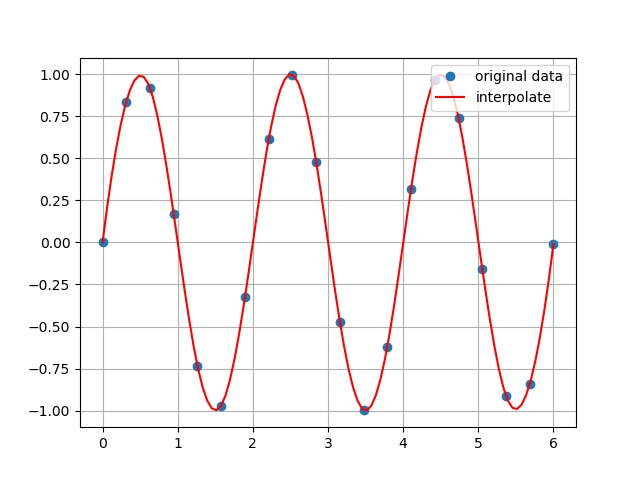
SciPiで補間曲線を描く
scipy.interpolate.interp1d を使って、補間曲線のデータを作成する。
kind パラメータに指定できるのは、linear = 線形補間、sliner = 一次スプライン補間、quadratic = 二次スプライン補間、cubic = 三次スプライン補間
#!/usr/bin/python
# -*- coding: utf-8 -*-

import matplotlib.pyplot as plt
import numpy as np
from scipy import interpolate

# 粗い sin 曲線(x軸20分割のデータを作成)
x = np.linspace(0, 6, 20)
y = np.sin(x*3.14)

# 補完曲線(データ補完して、x軸100分割のデータとする)
xn = np.linspace(0, 6, 100)
f = interpolate.interp1d(x, y, kind='cubic')
yn = f(xn)

fig, ax = plt.subplots()
# 粗い曲線(データがある部分の「点」のみ表示)
ax.plot(x, y, 'o', label='original data')
# 補完曲線
ax.plot(xn, yn, color='red', label='interpolate')
ax.grid()
ax.legend(loc='upper right')

plt.show()
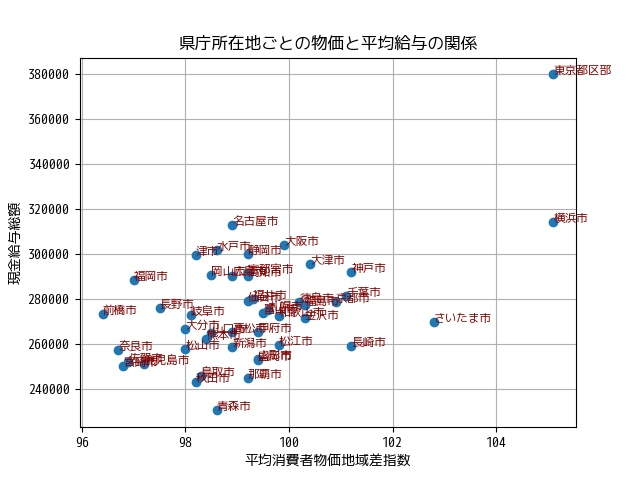
日本語フォントの利用とCSVデータからの散布図の作成
Python 3 と Python 2 の双方で実行可能な、日本語文字列を表示するスクリプトを作成してみた
#!/usr/bin/python
# -*- coding: utf-8 -*-

import matplotlib.pyplot as plt
import numpy as np
from scipy import interpolate

### 日本語フォントの設定
import matplotlib.font_manager as fm
from matplotlib import rcParams
fm._rebuild()
font_path = "/usr/share/fonts/truetype/mplus-TESTFLIGHT-063a/mplus-1m-medium.ttf"
font_prop = fm.FontProperties(fname=font_path)
plt.rcParams["font.family"] = font_prop.get_name()
### 日本語フォントの設定(ここまで)

# CSVファイルから、データを読み込む
data = np.genfromtxt('sanpuzu.csv', skip_header=1, delimiter=',', dtype=['U20', 'float', 'int'], usecols=[1,2,3], converters={1: lambda x: x.decode('utf_8')})

fig, ax = plt.subplots()

# 「点」のプロット
ax.plot(data['f1'], data['f2'], 'o')
# それぞれの点に対する「ラベル」
for i in range(data.size):
    ax.annotate(data[i][0], xy=(data[i][1], data[i][2]), fontsize='small', color='maroon')

ax.grid()
ax.set_title(u'県庁所在地ごとの物価と平均給与の関係')
ax.set_xlabel(u'平均消費者物価地域差指数')
ax.set_ylabel(u'現金給与総額')

plt.show()
読み込むCSVデータは次のようなもの
都道府県,県庁所在地,平均消費者物価地域差指数,現金給与総額
北海道,札幌市,99.6,275093
青森,青森市,98.6,230307
岩手,盛岡市,99.4,252656
宮城,仙台市,99.2,278847
秋田,秋田市,98.2,243014
山形,山形市,99.4,253131
福島,福島市,100.3,277150
茨城,水戸市,98.6,301913
栃木,宇都宮市,99.2,291574
群馬,前橋市,96.4,273227
埼玉,さいたま市,102.8,269827
千葉,千葉市,101.1,281349
東京,東京都区部,105.1,379858
神奈川,横浜市,105.1,314231
新潟,新潟市,98.9,258607
富山,富山市,99.5,273676
石川,金沢市,100.3,271260
福井,福井市,99.3,279745
山梨,甲府市,99.4,264987
長野,長野市,97.5,276071
岐阜,岐阜市,98.1,272856
静岡,静岡市,99.2,299973
愛知,名古屋市,98.9,312656
三重,津市,98.2,299360
滋賀,大津市,100.4,295613
京都,京都市,100.9,278542
大阪,大阪市,99.9,304025
兵庫,神戸市,101.2,291960
奈良,奈良市,96.7,257034
和歌山,和歌山市,99.8,272216
鳥取,鳥取市,98.3,245547
島根,松江市,99.8,259231
岡山,岡山市,98.5,290686
広島,広島市,98.9,290240
山口,山口市,98.5,264835
徳島,徳島市,100.2,278432
香川,高松市,98.9,265377
愛媛,松山市,98,257662
高知,高知市,99.2,290196
福岡,福岡市,97,288308
佐賀,佐賀市,96.9,251901
長崎,長崎市,101.2,259043
熊本,熊本市,98.4,261999
大分,大分市,98,266460
宮崎,宮崎市,96.8,250215
鹿児島,鹿児島市,97.2,250803
沖縄,那覇市,99.2,244571
numpy.genfromtxt を使ってCSVテキストファイルを読み込むスクリプトは次のようなもので
data = np.genfromtxt('sanpuzu.csv', skip_header=1, delimiter=',', dtype=['U20', 'float', 'int'], usecols=[1,2,3], converters={1: lambda x: x.decode('utf_8')})
CSVの幾つめのカラムを読み込むかは usecols=[1,2,3] のように指定し、カラムは0(ゼロ)から始まり、 0, 1, 2, 3 ... と数えられる。 また、読み取ったデータは型変換されて格納されるが、その型は dtype=['U20', 'float', 'int'] のように指定する。
dtypeには numpy.dtype の名前または Python の型名を指定する。詳しくは『NumPyのデータ型dtype一覧とastypeによる変換(キャスト)』、『NumPy : Data type objects (dtype)』などが参考になる。
よく使う例として、こういうものがある。
| 整数(8ビット) | int8 | i1 |
| 整数(16ビット) | int16 | i2 |
| 整数(32ビット) | int32 | i4 |
| 符号なし整数(8ビット) | uint8 | u1 |
| 浮動小数点(16ビット) | float16 | f2 |
| 浮動小数点(32ビット) | float32 | f4 |
| 文字列(Unicode) | unicode | U |
